

 Our mission is to lead innovation by providing the most advanced solutions in reliability and sustainability to empower…
 REC is looking to the future by aligning business goals with Saudi Arabia’s 2030 Vision. Part of this is investing in our young people and their future.
 Reliability Expert Center was established with the strategic vision of spreading a reliability and sustainability culture across Saudi Arabia.


Download Example File for Version 10 (*.rsgz10) or Version 9 (*.rsr9)
Repairs are tracked on automatic transmissions in a sample of 34 cars in a preproduction road test. The objective is to determine the mean cumulative number of repairs per car by 24,000 test miles (equivalently 5.5 x 24,000 = 132,000 customer miles).
(The data for this example appears on page 4 in Recurrent Events Data Analysis for Products Repairs, Disease Recurrences, and Other Applications, by Wayne B. Nelson, 2003.)
The data set shown in the following table consists of each car’s ID, its test mileage at each transmission repair and its latest observed mileage (marked with a +). The test was accelerated by a factor of 5.5.
| Car ID | Mileage (+ latest) | ||
| 24 | 7068 | 26744+ | |
| 26 | 28 | 13809+ | |
| 27 | 48 | 1440 | 29834+ |
| 29 | 530 | 25660+ | |
| 31 | 21762+ | ||
| 32 | 14235+ | ||
| 34 | 1388 | 21133+ | |
| 35 | 21401+ | ||
| 98 | 21876+ | ||
| 107 | 5094 | ||
| 108 | 21691+ | ||
| 109 | 20890+ | ||
| 110 | 22486+ | ||
| 111 | 19321+ | ||
| 112 | 21585+ | ||
| 113 | 18676+ | ||
| 114 | 23520+ | ||
| 115 | 17955+ | ||
| 116 | 19507+ | ||
| 117 | 24177+ | ||
| 118 | 22854+ | ||
| 119 | 17844+ | ||
| 120 | 22637+ | ||
| 121 | 375 | 19607+ | |
| 122 | 19403+ | ||
| 123 | 20997+ | ||
| 124 | 19175+ | ||
| 125 | 20425+ | ||
| 126 | 22149+ | ||
| 129 | 21144+ | ||
| 130 | 21237+ | ||
| 131 | 14281+ | ||
| 132 | 8250 | 21974+ | |
| 133 | 19250 | 21888+ | |
Step 1: Add a non-parametric recurrent event data analysis (RDA) folio to an existing project by choosing Insert > Folios > Non-Parametric RDA.
Step 2: For each car, enter the mileage for the transmission repairs (F) and the latest observed mileage (E) into the data sheet, as shown next.
Figure 1: Non-parametric RDA folio with data entered.
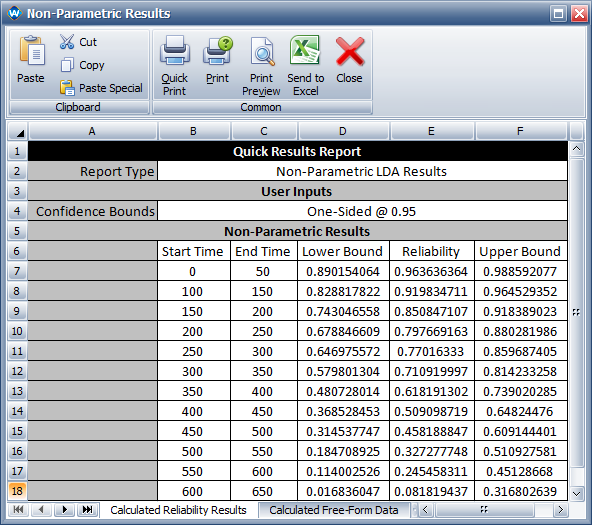
Figure 2: Non-parametric RDA results.
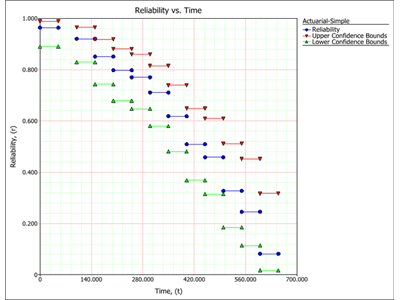
Figure 3: Mean Cumulative Function plot.
