

 Our mission is to lead innovation by providing the most advanced solutions in reliability and sustainability to empower…
 REC is looking to the future by aligning business goals with Saudi Arabia’s 2030 Vision. Part of this is investing in our young people and their future.
 Reliability Expert Center was established with the strategic vision of spreading a reliability and sustainability culture across Saudi Arabia.


Download Example File for Version 10 (*.rsgz10) or Version 9 (*.rsr9)
The reliability requirement for a new roller assembly is a reliability of 95% for 50,000 cycles at a 70% lower one-sided confidence level. The objective is to demonstrate this reliability goal through testing. The test lab at the manufacturing facility can test only 5 units at a time, so a test is set up for a sample size of 20 components (4 groups of 5 units each), to be run sequentially until the first failure in each group. In other words, the first group of 5 units is tested until one of the 5 units fails. After that, the second group is tested until the first failure and so forth.
The following data are recorded during the experiment:
| Group | Cycles to First Failure |
| 1 | 53,275 |
| 2 | 57,863 |
| 3 | 51,195 |
| 4 | 60,958 |
Even though the test is performed sequentially, the analysis can include all data as follows:
| Number in Group | Failure/ Suspension |
Cycles |
| 1 | F | 53,275 |
| 4 | S | 53,275 |
| 1 | F | 57,863 |
| 4 | S | 57,863 |
| 1 | F | 51,195 |
| 4 | S | 51,195 |
| 1 | F | 60,958 |
| 4 | S | 60,958 |
Step 1: Using Weibull++, the first step is to create a new standard folio for grouped times-to-failure (in cycles) with suspensions data.
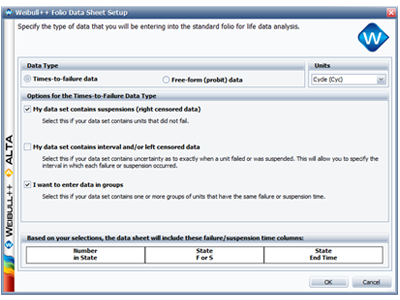
Figure 1: Data Sheet Setup window.
Step 2: The next step is to enter the life data from the test in the second table above. The data set is then analyzed using the 2-parameter Weibull distribution and MLE. The results are shown next.
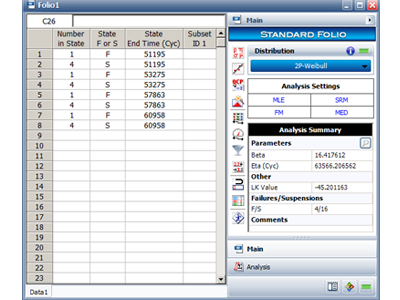
Figure 2: Standard folio with data and results.
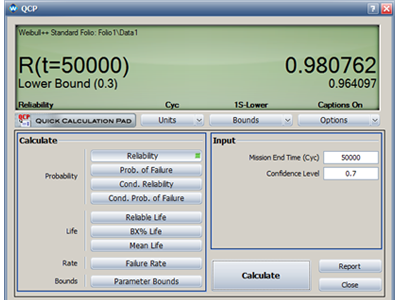
Step 3: The remaining task is to determine the demonstrated reliability at 50,000 cycles and at a 70% confidence level. The QCP in Weibull++ is used to compute this value, as shown next. In this case, the demonstrated reliability at the desired confidence level is found to be 96.41%, which is greater than the requirement, thus demonstrating the requirement.
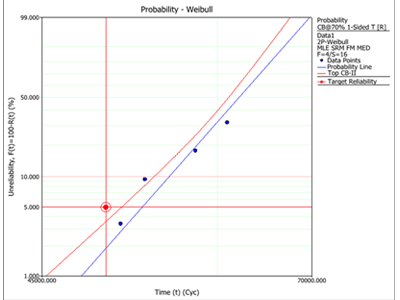
Alternatively, a probability plot can be obtained, which shows the same result. This is shown next. Note that range of the x-axis scale has been changed to 45,000 – 70,000.
It should be noted that since the test is run sequentially, the data can be analyzed once the second step is reached. When the data set is analyzed after the second step, it can be seen that the requirement is met by the second step, thus requiring no additional testing.
