

 Our mission is to lead innovation by providing the most advanced solutions in reliability and sustainability to empower…
 REC is looking to the future by aligning business goals with Saudi Arabia’s 2030 Vision. Part of this is investing in our young people and their future.
 Reliability Expert Center was established with the strategic vision of spreading a reliability and sustainability culture across Saudi Arabia.


Software Used: Software Used: ALTA PRO
Download Example File for Version 10 (*.rsgz10) or Version 9 (*.rsr9)
A complex fuel system is susceptible to leaks, as follows:
Determine the number of personnel who may be injured and the type of injury they will sustain if 100 units operate for 3,000 days.
Define models to describe the following:
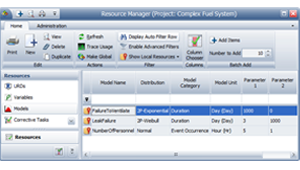
Note that for the NumberofPersonnel variable, the Model Unit has been set to Hours. This is because RENO flowchart results are always given in terms of the system base unit (SBU), and resources that require you to define a unit (i.e., Synthesis models) will have their values automatically converted to base units during simulation. Therefore, whenever you don’t want RENO to convert the value obtained from a model resource, simply make sure the model uses a unit that is defined as equal to 1 SBU. See the application help file for more information.
For this example, whenever the NumberofPersonnel model returns a value as “X hours,” it should be read as “X number of people.” If the model unit you are using is not equal to 1 SBU (choose File > Manage Repository > Manage Units to confirm), you will need to change the model units before resimulating the flowchart.
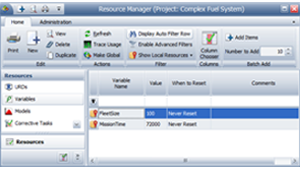
Define variables to store the fleet size (100 units) and days of operation (3,000 days x 24 hours = 72,000 hours, where hour is the default time unit used in the database), as shown next.
To create this subchart, follow these steps:
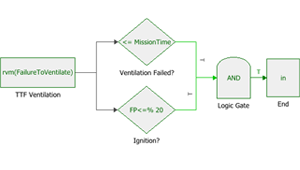
Step 1: Because this flowchart will be referenced by another flowchart, a single starting point and a single end point is required. First, use a standard block as the start block. In this block, use the RENO internal function called “rvm” to return a random value based on the FailureToVentilate model.
Step 2: Use two conditional blocks to evaluate whether the ventilation failed and whether an ignition occurred. To determine whether an ignition occurred, the conditional block in this example uses the FP<=% condition, which is a special case where the conditional block itself draws a random number uniformly distributed from 0 to 100, and then evaluates whether the number is less than or equal to the condition value. If the event occurred, the conditional block passes an output to the “true” path to continue the simulation. If the event did not occur, then there is no risk.
Step 3: Pass the results from the conditional blocks to an AND gate to determine whether both events have occurred. If both events occurred, pass a 1 to the “true” path to continue the simulation; if not, then there is no risk and the simulation ends because no “false” path exists.
Step 4: Use a standard block and the RENO internal function called “in” to hold the output from the AND gate. This block serves as the end point of the subchart.
The following picture shows the subchart for the risk of personnel injury.

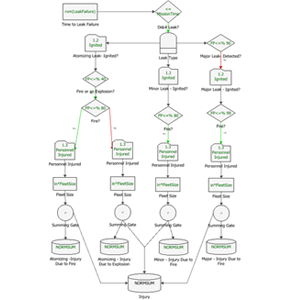
In order to estimate the number of injured personnel, we first need to be able to determine the type of injury (fire or explosion). One way to do that is to have the main flowchart pass a coded value to the subchart. Let us assign the value 1 to indicate a fire, and the value 0 to indicate an explosion.
Step 5: Use a standard block as the start block. In this block, use the RENO internal function called “in” to accept a value from the parent flowchart. In this case, in = 1 indicates a fire and in = 0 indicates an explosion.
Step 6: Use a conditional block to check if there were people in the compartment. If people were present, use the RENO internal function “in” to pass the value from the Start block to the next conditional block in the flowchart. If there were no people around, then there is no risk and the simulation will end because no “false” path exists.
Step 7: Use a conditional block to check the value of “in.” If in = 1, then a fire occurred. Use another conditional block to determine whether people were injured by the fire. If in = 0, then an explosion occurred. Use a separate conditional block to determine whether people were injured by the explosion.
Step 8: In each case (fire and explosion) use a standard block and the RENO internal function called “in” to return a random value based on the NumberofPersonnel model.
Step 9: Use a summing gate to serve as the end point of the subchart and to pass the sum of the values from Step 8 to the parent flowchart.
You can now construct the main flowchart, as shown on the next:
Step 10: Use a standard block to obtain a random time to leak failure.
Step 11: Use a conditional block to check whether the leak occurred during the mission time. If a leak occurred, pass the LeakTypeProbability to the “true” path; if a leak did not occur, then there is no risk and the simulation ends because no “false” path exists.
Step 12: If a leak occurred, use a branch gate to check which type of leak it was, as shown next. In this case, the simulation will continue down the first branch that evaluates to true.
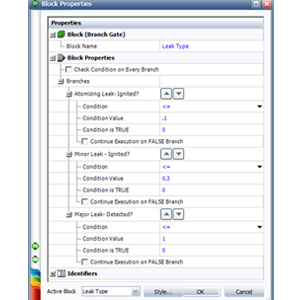
Step 13: In all branches:
Run 1,000 simulations on the main flowchart, with a seed of 1 for repeatability. The results show the following estimates:
