

 Our mission is to lead innovation by providing the most advanced solutions in reliability and sustainability to empower…
 REC is looking to the future by aligning business goals with Saudi Arabia’s 2030 Vision. Part of this is investing in our young people and their future.
 Reliability Expert Center was established with the strategic vision of spreading a reliability and sustainability culture across Saudi Arabia.


Download Example File for Version 10 (*.rsgz10) or Version 9 (*.rsr9)
Assume that chemical X is added to a suntan lotion. The manufacturing process contains some minor variability. The concentration of chemical X is normally distributed with a mean of 0.005 and a standard deviation of 0.0001 ml of chemical X per ml of lotion.
The amount of lotion applied by a person also varies and is known to be normally distributed with a mean of 100 ml and standard deviation of 20 ml.
It is suspected that 10% of the population may, depending on the amount used, have an allergic reaction to chemical X. From the 10% who are susceptible, the probability that someone will have an allergic reaction is a function of the amount of the chemical applied. This probability is given by a Weibull distribution with beta of 2.5 and eta of 1.8.
Determine the percentage of the population that is expected to experience an allergic reaction.
Define models to describe the concentration of chemical X in the suntan lotion and the amount of lotion applied, as shown below.
Note that even though the amount of product is measured in milliliters, the Model Unit has been set to Hours. This is because RENO flowchart results are always given in terms of the system base unit (SBU), and resources that require you to define a unit (i.e., Synthesis models) will have their values automatically converted to base units during simulation. Therefore, whenever you don’t want RENO to convert the value obtained from a model resource, simply make sure the model uses a unit that is defined as equal to 1 SBU. See the application help file for more information.
For this example, whenever one of the models returns a value as “X hours,” it should be read as “X ml.” If the model unit you are using is not equal to 1 SBU (choose File > Manage Repository > Manage Units to confirm), you will need to change the model units before resimulating the flowchart.
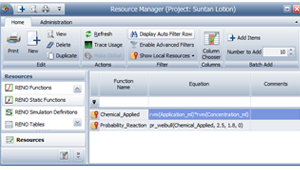
Define RENO static functions to calculate the amount of chemical X applied by the user and the likelihood that the user will have a reaction to the chemical.
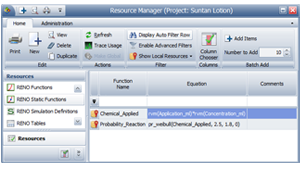
Here, Chemical_Applied is equal to the amount of lotion applied multiplied by the concentration of chemical X in the lotion. The equation uses the RENO internal function called “rvm” to return a random value based on the Application_ml model and the Concentration_ml model.
Probability_Reaction uses the predefined function called “pr_weibull” to obtain a probability value based on the amount of chemical X applied. The function returns the probability from the Weibull cumulative distribution function evaluated at x. Here, the x value is based on the result of the Chemical_Applied function, and the parameters of the Weibull distribution are 2.5 (beta), 1.8 (eta) and 0 (gamma).
Construct the flowchart as follows:
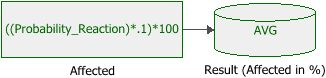
Step 1: Use a standard block to calculate the percentage of the population affected, based on the probability of a reaction. This is calculated by multiplying the value of the probability by the percentage of the population that is susceptible (0.1), and then by 100 to convert the figure into a percentage.
Step 2: Use a result storage block to store the average of the results.
Run 2,000 simulations, with a seed of 1 for repeatability. The result shows that 0.424469% of the population is expected to experience a reaction to the lotion.
