

 Our mission is to lead innovation by providing the most advanced solutions in reliability and sustainability to empower…
 REC is looking to the future by aligning business goals with Saudi Arabia’s 2030 Vision. Part of this is investing in our young people and their future.
 Reliability Expert Center was established with the strategic vision of spreading a reliability and sustainability culture across Saudi Arabia.


Software Used: Software Used: ALTA PRO
Download Example File for Version 10 (*.rsgz10) or Version 9 (*.rsr9)
A hinge is made up of four components. Suppose that the dimensions of the components vary as follows:
Determine the expected times that (A+B+C) will be greater than D.
Define a model for each component, as shown next. This is equivalent to the first requirement in the flowchart given above.
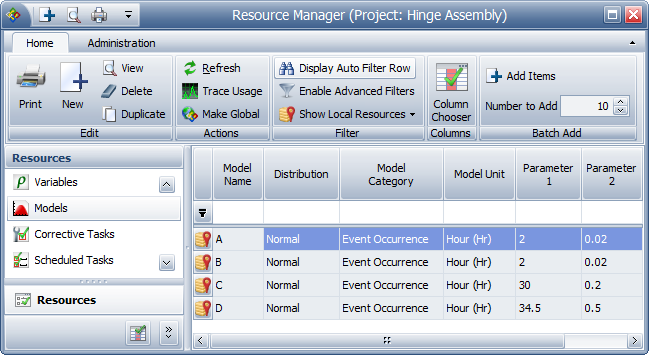
Note that even though the component width is measured in inches, the Model Unit has been set to Hours. This is because RENO flowchart results are always given in terms of the system base unit (SBU), and resources that require you to define a unit (i.e., Synthesis models) will have their values automatically converted to base units during simulation. Therefore, whenever you don’t want RENO to convert the value obtained from a model resource, simply make sure the model uses a unit that is defined as equal to 1 SBU. See the application help file for more information.
For this example, whenever one of the models returns a value as “X hours,” it should be read as “X inches.” If the model unit you are using is not equal to 1 SBU (choose File > Manage Repository > Manage Units to confirm), you will need to change the model units before resimulating the flowchart.
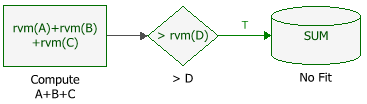
To construct this flowchart, follow these steps:
Step 1: Use a standard block to draw values for the widths of components A, B and C and calculate the sum of those values. In this example, the block uses the RENO internal function called “rvm” to draw random values based on the A model, B model and C model.
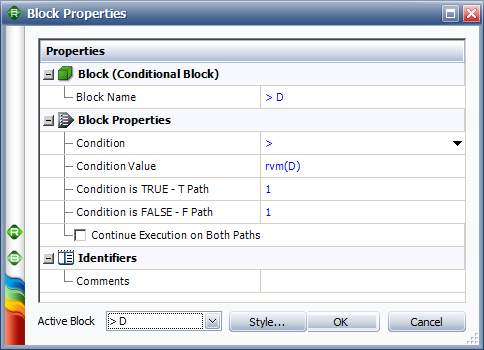
Step 2: Use a conditional block to check whether the value of A+B+C is greater than the value of D. If the condition is met, the block will pass the value 1 down the “true” path to the next block. If the condition is not met, RENO will terminate the simulation because a “false” path does not exist.
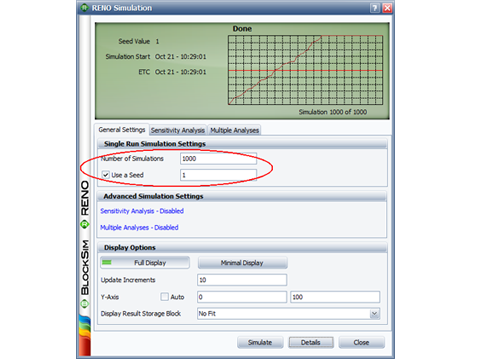
Note that it is not necessary to create a loop (i.e., an instruction to repeat the steps for N simulations) because RENO is designed to run multiple simulations of a flowchart by default. The number of simulations is specified via the RENO Simulation window, as shown next.
To express the result as a percentage, rather than a count, the following modifications can be added to the flowchart:
Step 4: Configure the conditional block to pass a value of 100 when the condition is met.
Step 5: Configure the result storage block to store the Normalized Sum of Results. This adds all the values passed to it during simulation and divides the number by the total number of simulations, resulting in the percentage of time that the hinge assembly fell out of specification.
If you perform the same number of simulations, using the same seed value, the result will show that the probability that A+B+C is greater than D is about 18.3%.
