

 Our mission is to lead innovation by providing the most advanced solutions in reliability and sustainability to empower…
 REC is looking to the future by aligning business goals with Saudi Arabia’s 2030 Vision. Part of this is investing in our young people and their future.
 Reliability Expert Center was established with the strategic vision of spreading a reliability and sustainability culture across Saudi Arabia.


Download Example File for Version 10 (*.rsgz10) or Version 9 (*.rsr9)
This example studies the effects of different inspection intervals on a system’s point availability.
Odyssey Airlines uses inflatable life vests manufactured by ACME Life Vest Company aboard its commercial aircraft. All the vests on the aircraft undergo scheduled inspections. The vests are stored until they are required for use; therefore, failures remain dormant until the system is needed, or failed vests are discovered during inspections. Vests found failed are discarded and replaced with new vests (thus resulting in a mix of vests of different ages aboard an aircraft).
According to the replacement data obtained from past inspections, the dormant failure distribution for these vests follows a Weibull distribution with beta = 2.55 and eta = 6.89 years.
Odyssey Airlines is considering different inspection intervals for these life vests. The objective is to study the effect of inspections done annually, every two years and every three years.
One way to approach this in BlockSim is to use a simulation diagram and set up a single block with a universal reliability definition (URD) that describes the dormant failure distribution. The following figure shows the Block Properties window for the block representing the life vest. The steps for configuring the URD are described next.
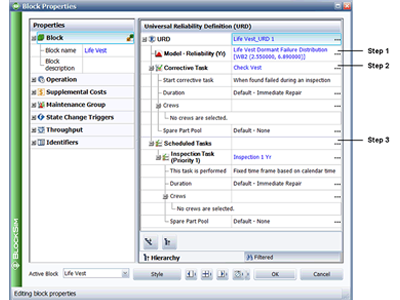
Figure 1: Block Properties Window for the Life Vest
Figure 2: Model Wizard
Step 2: During inspection, if a vest is found failed, it is replaced; thus a corrective task needs to be set for the block. To do this, double-click the Corrective Task field in the Universal Reliability Definition area (shown in Figure 1). This opens a Maintenance Task window that allows you to enter the details of the corrective task.
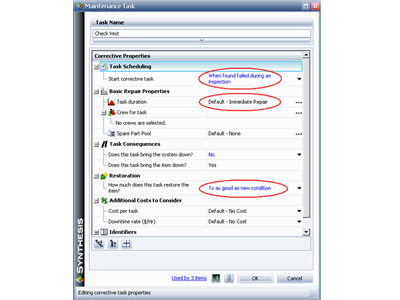
Figure 3: Maintenance Task Window for a Corrective Task
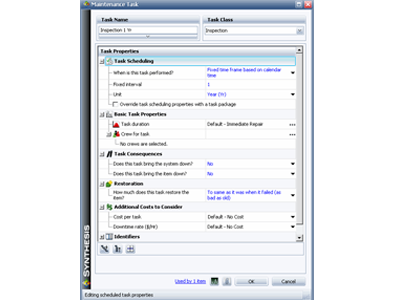
Figure 4: Maintenance Task Window for a Scheduled Task
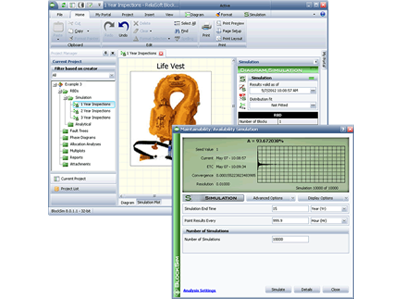
Figure 5: Maintainability/Availability Simulation Window
The following plot shows the analysis with the annual inspections for a period of 15 years. The x-axis shows the time period while the y-axis shows the estimated A(t). As you can see, A(t) approaches a value close to 1 after each inspection, implying that 100% of the vests are in a non-failed state after each inspection.
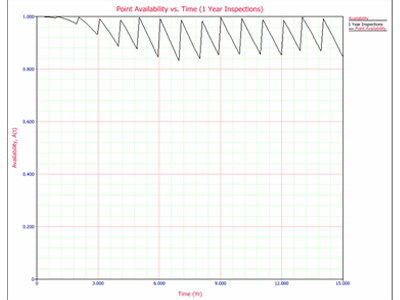
Figure 6: Point Availability Plot – Annual Inspection
On the 3rd year, the value of A(t) is approximately 95%. This implies that 5% of the vests on the aircraft are in a failed state at that point in time. Furthermore, note the following:
The following plots show the analysis using the 2- and 3-year inspection plans for the same period of 15 years. As you can see, the longer the inspection interval, the higher the rate of decrease of A(t) after each subsequent inspection.
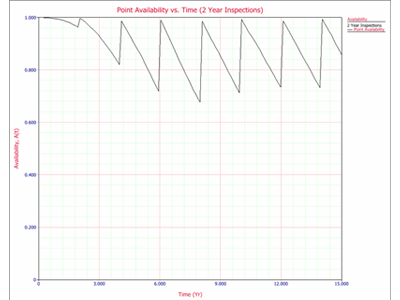
Figure 7: Point Availability Plot – Two Year Inspection Plan
