

 Our mission is to lead innovation by providing the most advanced solutions in reliability and sustainability to empower…
 REC is looking to the future by aligning business goals with Saudi Arabia’s 2030 Vision. Part of this is investing in our young people and their future.
 Reliability Expert Center was established with the strategic vision of spreading a reliability and sustainability culture across Saudi Arabia.


Download Example File for Version 10 (*.rsgz10) or Version 9 (*.rsr9)
A telecommunications system is to be constructed in an uninhabited stretch of jungle. The system consists of a transmitter and receiver with six relay stations to connect them.
The relays are situated so that the signal originating from one station can be picked up by the next two stations down the line. For example, a signal from the transmitter can be received by Relay 1 and Relay 2, a signal from Relay 1 can be received by Relay 2 and Relay 3 and so forth. Thus, this arrangement would require two consecutive relays to fail for the system to fail. (This is also known as a consecutive-k-out-of-n:F system.)
Furthermore, the transmitter and receiver are made up of three subassemblies each, while the relay stations have two subassemblies each (all in series). Specifically:
Figure 1: RBD of Telecommunications System
Each component (transmitter, receiver, relay) is represented by a subdiagram block. The following pictures show the subassemblies of each component.
Figure 2: RBD of Transmitter

Figure 3: RBD of Receiver

The failure distributions for each subassembly are given in the following table.
| Component | Failure Distribution | Parameters |
| SPS1 | Weibull | Beta = 2 Eta = 25,000 hours |
| TRC1 | Weibull | Beta = 3 Eta = 20,000 hours |
| TRC2 | Exponential | Mean = 85,000 hours |
| RCR1 | Exponential | Mean 150,000 hours |
| RCR2 | Weibull | Beta = 2 Eta = 30,000 hours |
| RLYC1 | Exponential | Mean = 100,000 hours |
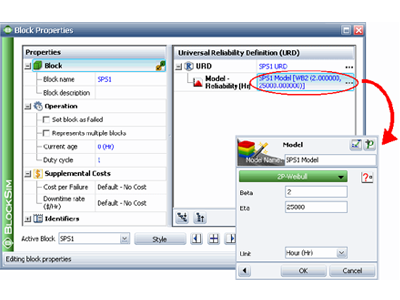
Figure 5: Block Properties Window of SPS1 and the Model Wizard (inset)
Figure 6: Analytical QCP
Figure 6: Standardized Residuals plot.
Based on this analysis, the projected shelf life of this product is 15.6 months. The desired result can also be obtained from the QCP, as shown next.
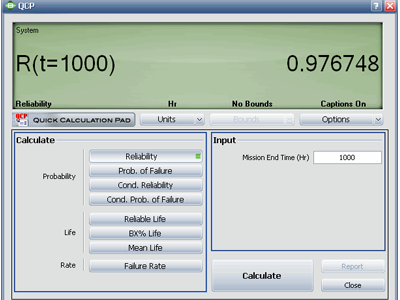
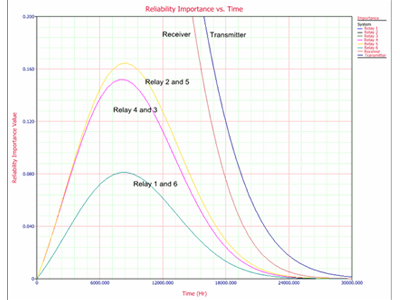
Figure 7: Reliability Importance Plot
