

 Our mission is to lead innovation by providing the most advanced solutions in reliability and sustainability to empower…
 REC is looking to the future by aligning business goals with Saudi Arabia’s 2030 Vision. Part of this is investing in our young people and their future.
 Reliability Expert Center was established with the strategic vision of spreading a reliability and sustainability culture across Saudi Arabia.


Download Example File for Version 10 (*.rsgz10) or Version 9 (*.rsr9)
When thinking of a reliability block diagram (RBD), the application that most often comes to mind is the analysis of a system based on the component reliabilities, but you can also use the same methodology to analyze a single component and its associated failure modes.
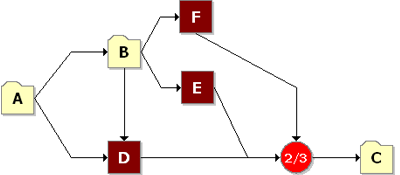
Consider a component that can fail due to six independent primary failure modes: A, B, C, D, E and F. The component fails if mode A, B or C occurs. If mode D, E or F occurs alone, the component does not fail; however, the component will fail if any two (or more) of these modes occur (i.e., D and E; D and F; E and F). Furthermore, assume that modes A, B and C can be broken down further into the events (sub-modes) that can cause them. Once a mode occurs, its sub-mode also occurs and does not go away.
The following RBD illustrates the relationship between the primary modes. The subdiagram blocks A, B and C contain the sub-modes, and the node represented by 2/3 indicates the k-out-of-n configuration (in this case, 2 out of 3 paths must occur for the component to fail).
The objective of the analysis is to obtain the following:
We begin the analysis by defining the sub-modes of blocks A, B and C.
There are five independent (i.e., if one mode occurs, the rest are not more likely to occur) sub-modes associated with mode A: events S1, S2, T1, T2 and Y. Assume that:
There are three possible ways for mode A to manifest itself:
The following RBD illustrates the conditions for mode A.
Figure 2: RBD of Mode A
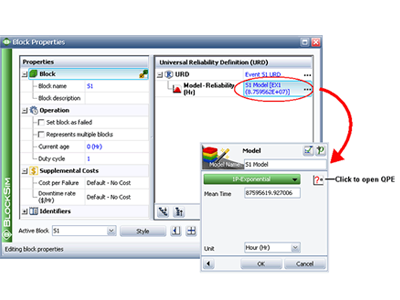
Figure 3: Block Properties Window and Model Wizard (inset)
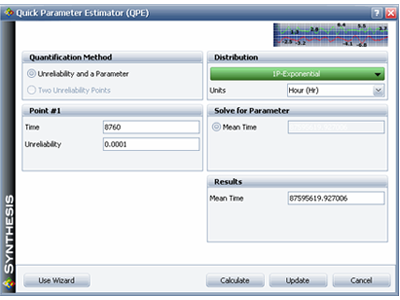
Figure 4: Quick Parameter Experimenter and the Mean Time of Event S1
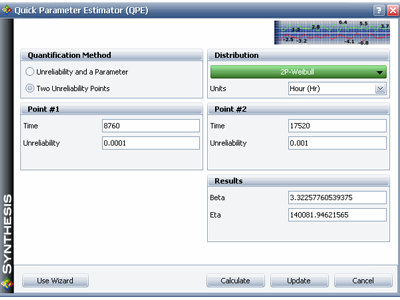
Figure 5: Quick Parameter Experimenter and the Parameters of Event T1
There are three dependent sub-modes associated with mode B: events BA, BB and BC. Two out of the three events must occur for mode B to occur. Events BA, BB and BC have an exponential distribution with a mean of 50,000 hours. The events are dependent (i.e., if BA, BB or BC occurs, the remaining events are more likely to occur). Specifically, when one event occurs, the MTTF of the remaining events is cut in half. This is basically a load sharing configuration. The reliability function for each block will change depending on the other events. Therefore, the reliability of each block is not only dependent on time, but also on the stress (load) that the block sees.
Figure 6: Load Sharing Container for Mode B
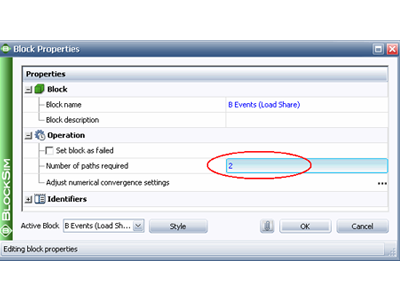
Figure 7: Block Properties Window of Load Sharing Container
To describe the dependency between the events, BlockSim uses a multiplier called the weight proportionality factor, which determines how the load will be shared. For example, if a container holds two blocks and one block has a factor of 3 while the other has a factor of 9, then the first block will receive 25% of the load (3/12) and the second block will receive 75% of the load (9/12).
In this case, all three contained blocks have a weight proportionality factor equal to 1, indicating that they will share the load evenly (33.33% of the load each) when all are operating. If one fails, then the other two will take over the load. The weight proportionality factor needs to be set up in each block in the load sharing container, as shown in the following example.
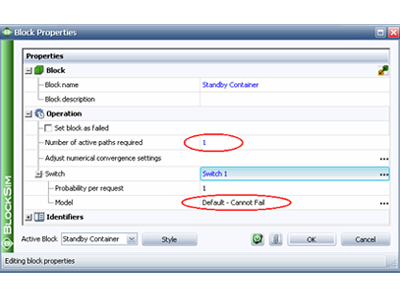
Figure 6: Load Sharing Container for Mode B
Figure 8: Block Properties Window of Sub-Mode BA
There are two sequential sub-modes associated with mode C: events CA and CB. Both events must occur for mode C to occur. Event CB will occur only if event CA has occurred. If event CA has not occurred, then event CB will not occur. Both events, CA and CB, occur based on a Weibull distribution. For event CA, beta = 2 and eta = 30,000 hours. For event CB, beta = 2 and eta = 10,000 hours.
This scenario is similar to standby redundancy. Basically, if CA occurs then CB gets initiated. The following picture shows the RBD of mode C. The blocks representing the sub-modes are inside a standby container.
Figure 9: Standby Container for Mode C
The following picture shows the Block Properties window of the standby container. For this analysis, a perfect switch (always works, instant switch and no delays) is assumed; therefore, the switch model is set to Default-Cannot Fail. The Number of active paths required field indicates that at least one event must occur for mode C to occur
Figure 10: Block Properties Window of Standby Container
The operation of block CA is then set to Active (as shown in Figure 11), while block CB is set to Standby.
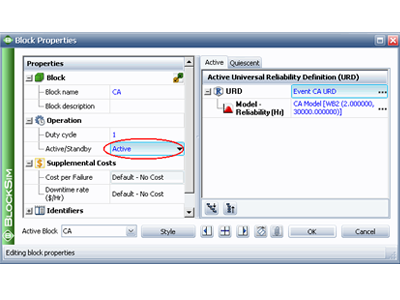
Figure 11: Block Properties Window of Sub-mode CA
Figure 11: Block Properties Window of Sub-mode CA
Modes D, E and F can all be represented using the exponential distribution. The failure distribution properties for modes D, E and F are presented next.
The last step is to set up the RBD of the component in BlockSim (as shown in Figure 1), and then calculate the answers to the questions posed earlier.
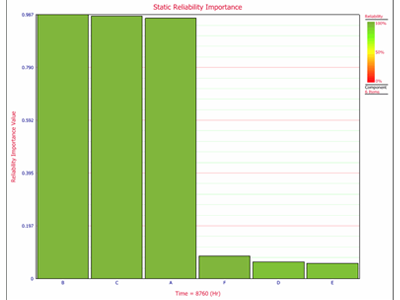
Figure 12: Static Reliability Importance Plot at t = 8,760 hours
