

 Our mission is to lead innovation by providing the most advanced solutions in reliability and sustainability to empower…
 REC is looking to the future by aligning business goals with Saudi Arabia’s 2030 Vision. Part of this is investing in our young people and their future.
 Reliability Expert Center was established with the strategic vision of spreading a reliability and sustainability culture across Saudi Arabia.


Download Example File for Version 10 (*.rsgz10) or Version 9 (*.rsr9)
This example is based on the example shown in Figure 8 of the article “Determining the Availability and Reliability of Storage Configurations” by Santosh Shetty, August 2002, as posted on Dell’s website.
Consider a “high-availability” cluster with a reliability block diagram (RBD), as shown next.
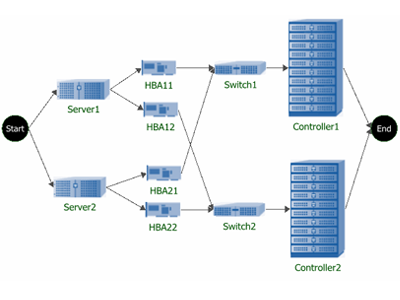
Figure 1: Storage Cluster System
Assume the following life distributions and parameters for the components: (Note that this example, unlike the original article, assumes no repair of failed components.)
The objective of the analysis is to study the reliability of the system.
Step 1: Create the RBD of the system in BlockSim, and then use the given information to configure the universal reliability definitions (URDs) of each block. For example, the following picture shows the Block Properties window of Server1. The inset shows the Model Wizard, which allows you to define the failure model of the block. The URDs of the other blocks can be configured in a similar manner.
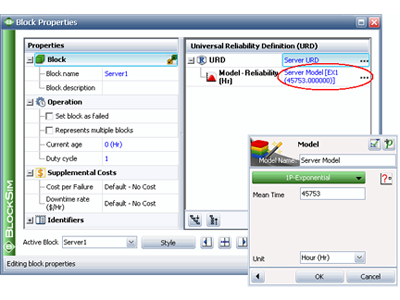
Figure 2: Block Properties Window of Server1 and Model Wizard (inset)
Step 2: Once the URDs have been configured, analyze the diagram and obtain the system reliability equation of the system, as shown next.
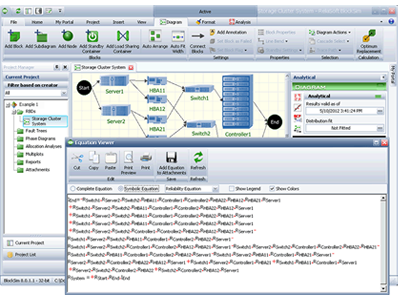
Figure 3: System Reliability Equation of the Storage Cluster System
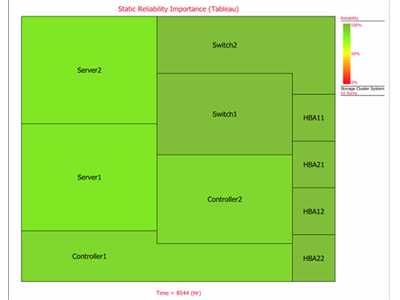
Figure 4: Static Reliability Importance – Tableau Area Chart
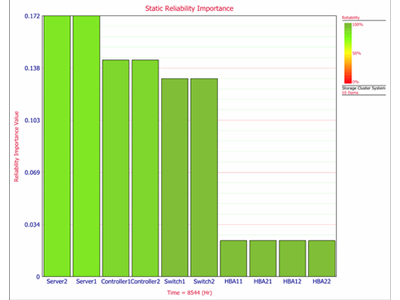
Figure 5: Static Reliability Importance – Bar Chart
As you can see, the servers in this configuration are the most critical component, while the hubs are the least critical.
The following pictures show additional plots.
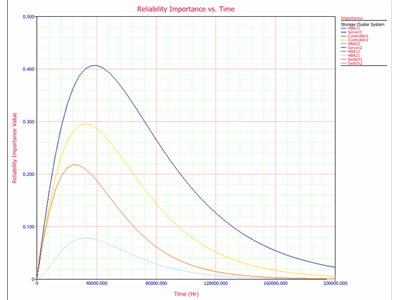
Figure 6: RI vs. Time Plot
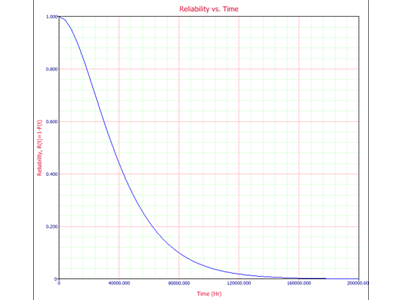
Figure 7: System Reliability Plot
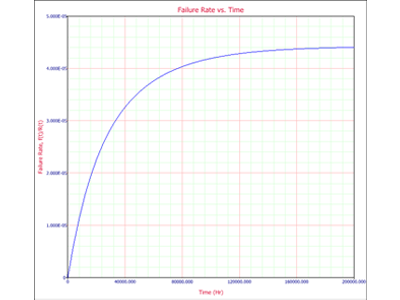
Figure 8: System Failure Rate Plot
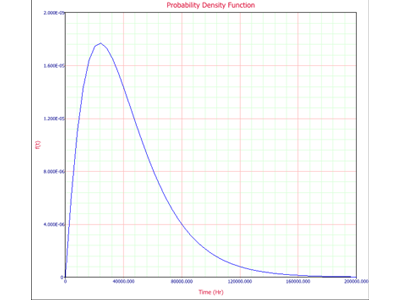
Figure 9: System pdf plot
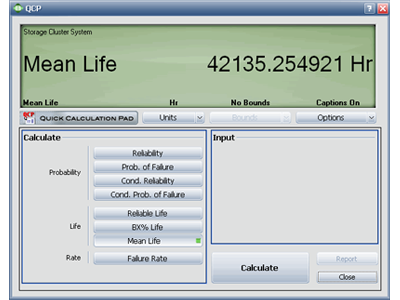
Figure 10: Analytical QCP
