

 Our mission is to lead innovation by providing the most advanced solutions in reliability and sustainability to empower…
 REC is looking to the future by aligning business goals with Saudi Arabia’s 2030 Vision. Part of this is investing in our young people and their future.
 Reliability Expert Center was established with the strategic vision of spreading a reliability and sustainability culture across Saudi Arabia.


Download Example File for Version 10 (*.rsgz10) or Version 9 (*.rsr9)
A particular component can fail due to six independent primary failure modes: A, B, C, D, E and F. The component fails if mode A, B or C occurs. If mode D, E or F occurs alone, the component does not fail; however, the component will fail if any two (or more) of these modes occur (i.e., D and E; D and F; E and F). The objective is to analyze each failure mode using the 2-parameter Weibull distribution with MLE and to determine the lower 1-sided 90% confidence bound on the reliability of this component at 100 hours.
An independent test on each failure mode is conducted. The following tables record the times-to-failure data of each mode (in hours).
| Mode A | Mode B | Mode C | ||||||||
| Number in Group |
State | Time | Number in Group |
State | Time | Number in Group |
State | Time | ||
| 1 | F | 1144 | 1 | F | 19 | 1 | F | 2221 | ||
| 1 | F | 1719 | 1 | F | 140 | 1 | F | 2257 | ||
| 1 | F | 2129 | 1 | F | 292 | 1 | F | 2569 | ||
| 1 | F | 2803 | 1 | F | 432 | 1 | F | 3029 | ||
| 1 | F | 3020 | 1 | F | 528 | 1 | F | 3805 | ||
| 1 | F | 3082 | 1 | F | 552 | 10 | S | 5000 | ||
| 1 | F | 3589 | 1 | F | 605 | |||||
| 1 | F | 3973 | 1 | F | 734 | |||||
| 1 | F | 4337 | 1 | F | 779 | |||||
| 1 | F | 5011 | 1 | F | 874 | |||||
| 1 | F | 5029 | ||||||||
| 18 | S | 5500 | ||||||||
| Mode D | Mode E | Mode F | ||||||||
| Number in Group |
State | Time | Number in Group |
State | Time | Number in Group |
State | Time | ||
| 1 | F | 1063 | 1 | F | 1290 | 1 | F | 605 | ||
| 1 | F | 1085 | 1 | F | 2261 | 1 | F | 760 | ||
| 1 | F | 1399 | 1 | F | 2355 | 1 | F | 773 | ||
| 1 | F | 1445 | 1 | F | 3209 | 1 | F | 854 | ||
| 1 | F | 1550 | 1 | F | 3284 | 1 | F | 890 | ||
| 1 | F | 2056 | 1 | F | 3394 | 1 | F | 1165 | ||
| 1 | F | 4384 | 1 | F | 3596 | 1 | F | 1220 | ||
| 1 | F | 4863 | 1 | F | 4203 | 1 | F | 1320 | ||
| 8 | S | 5000 | 1 | F | 4254 | 1 | F | 1967 | ||
| 1 | F | 4294 | 1 | F | 2606 | |||||
| 1 | F | 4420 | 1 | F | 2834 | |||||
| 10 | S | 5000 | 15 | S | 3000 | |||||
Step 1: Create a new Weibull++ standard folio data sheet that holds grouped times-to-failure data with suspensions.
Step 2: Rename the folio to “Component” and the data sheet to “A.” Enter the data given for Failure Mode A and use the 2-parameter Weibull distribution with MLE to calculate the parameters, as shown next.

Figure 1: Data sheet A with data entered and results shown.
Step 3: Insert another data sheet into the folio by choosing Life Data > Folio Sheets > Insert Data Sheet. Rename the new data sheet to “B,” enter the data given for Failure Mode B and calculate the parameters. Repeat for the remaining failure modes.
Step 4: Add a diagram to the project by choosing Insert > Tools > Diagram. Click the Data Sheets page of the diagram control panel. All the calculated data sheets in the project will be shown. Drag a data sheet onto the diagram to create a block that represents that data sheet.
Figure 1: Degradation analysis folio.
The following plot shows the exponential curves for six of the tested samples (with the scaling adjusted to Y= 40 to 100 and X= 0 to 20).
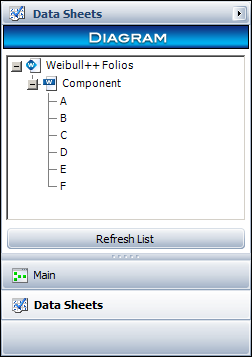
Figure 2: Data Sheets page of the diagram control panel.
Step 5: Build the RBD that describes the reliability-wise configuration of the failure modes. To add a node that requires that 2 out of 3 paths must function for the system to function, choose Diagram > Diagram Tools > Add Node. Then double-click the node to specify the number of required paths.
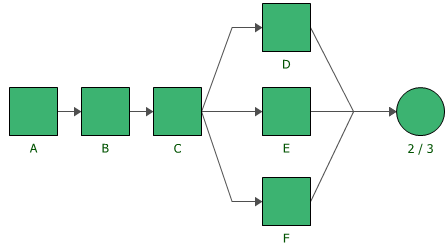
Figure 3: Completed reliability block diagram.
Step 6: Return to the Main page of the diagram control panel, then click Calculate to analyze the diagram. Use the Quick Calculation Pad to calculate the lower 1-sided 90% confidence bound on the reliability at 100 hours. The lower bound is estimated to be 82.23%, as shown next.
Figure 4: Solving for the lower 90% 1-sided confidence bound on reliability at 100 hours.
