

 Our mission is to lead innovation by providing the most advanced solutions in reliability and sustainability to empower…
 REC is looking to the future by aligning business goals with Saudi Arabia’s 2030 Vision. Part of this is investing in our young people and their future.
 Reliability Expert Center was established with the strategic vision of spreading a reliability and sustainability culture across Saudi Arabia.


Download Example File for Version 10 (*.rsgz10) or Version 9 (*.rsr9)
A group of 55 units are put on a life test during which the units are evaluated every 50 hours. Use the simple actuarial method to determine reliability estimates for each failure time.
The results of the test are displayed in the table shown next.
| Start Time | End Time | Number of Failures | Number of Suspensions |
| 0 | 50 | 2 | 4 |
| 50 | 100 | 0 | 5 |
| 100 | 150 | 2 | 2 |
| 150 | 200 | 3 | 5 |
| 200 | 250 | 2 | 1 |
| 250 | 300 | 1 | 2 |
| 300 | 350 | 2 | 1 |
| 350 | 400 | 3 | 3 |
| 400 | 450 | 3 | 4 |
| 450 | 500 | 1 | 2 |
| 500 | 550 | 2 | 1 |
| 550 | 600 | 1 | 0 |
| 600 | 650 | 2 | 1 |
Step 1: Add a non-parametric life data analysis (LDA) folio to an existing project by choosing Insert > Folios > Non-Parametric LDA.
Step 2: Once the folio is created, select the Actuarial-Simple data type on the control panel. This will format the data sheet correctly for your input. Next, enter the data from the above table. The cells in the Available Units column will be filled in automatically.
Step 3: Click Calculate to calculate the reliability estimates for the data set. The folio will now appear as shown next.
Figure 1: Non-parametric LDA folio with data entered and results shown.
Click anywhere inside the Non-Parametric Results area to display the reliability estimates.

Figure 2: Non-parametric LDA results.
Step 4: Next, plot the reliability vs. time, as shown next.
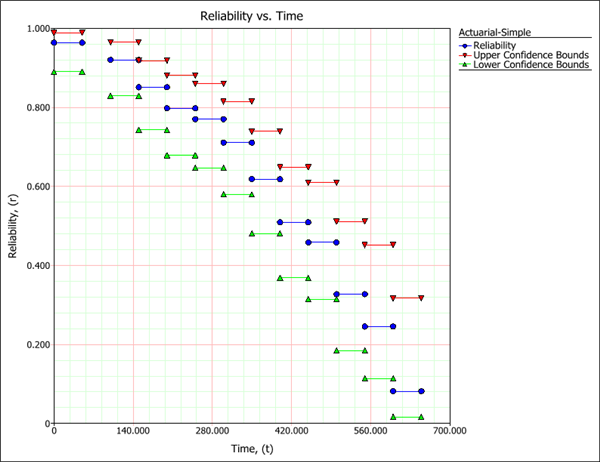
Figure 3: Reliability vs. Time plot.
