

 Our mission is to lead innovation by providing the most advanced solutions in reliability and sustainability to empower…
 REC is looking to the future by aligning business goals with Saudi Arabia’s 2030 Vision. Part of this is investing in our young people and their future.
 Reliability Expert Center was established with the strategic vision of spreading a reliability and sustainability culture across Saudi Arabia.


Download Example File for Version 10 (*.rsgz10) or Version 9 (*.rsr9)
A company keeps track of its shipments and warranty returns on a month-by-month basis. Using the warranty analysis folio, determine the parameters for a 2-parameter Weibull distribution and predict the number of products from each of the three shipment periods that will be returned under warranty in October.
In June, 100 units are sold and in July, three are returned. This gives 3 failures at one month for the June shipment. Likewise, 3 failures occur in August and 5 occur in September for this shipment. Consequently, at the end of the three-month analysis period, there are a total of 11 failures for the 100 units shipped in June. This means that 89 units are presumably still operating and can be considered suspensions at three months.
For the shipment of 140 in July, 2 are returned the following month and 4 more are returned the month after that. After two months, there are 134 units from the July shipment still operating.
For the final shipment of 150 in August, 4 fail in September, with the remaining 146 units being suspensions at one month.
The shipment and returns data are shown in the following table.
| Month | Shipments | Returns | ||
| July | August | September | ||
| June | 100 | 3 | 3 | 5 |
| July | 140 | – | 2 | 4 |
| August | 150 | – | – | 4 |
Step 1: Create a new warranty analysis folio using the Nevada data format. On the second page of the Warranty Folio Setup window, make the selections shown next.
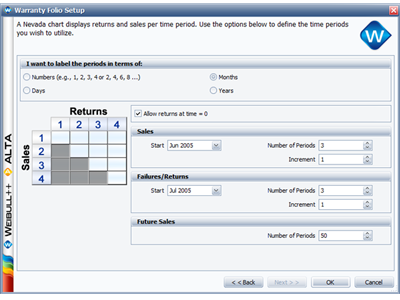
Figure 1: Second page of the Warranty Folio Setup window for Nevada chart format folios.
Step 2: Enter the shipments data on the Sales data sheet and the returns data on the Returns sheet. Then select the 2-parameter Weibull distribution with MLE. The folio will appear as shown next.
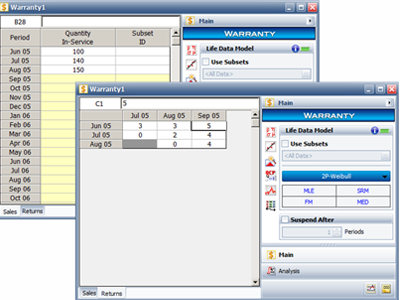
Figure 2: Warranty folio with data entered and calculation options selected.
Step 3: Click Calculate. Weibull++ automatically converts the warranty data into failure/suspension times and estimates the parameters of the chosen distribution. The results are beta = 2.4928 and eta = 6.6951.
To show the converted failure/suspension data, click the Detailed Summary icon  on the control panel.
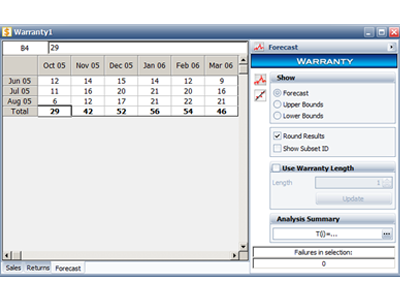
Figure 4: Forecast data sheet.
