

 Our mission is to lead innovation by providing the most advanced solutions in reliability and sustainability to empower…
 REC is looking to the future by aligning business goals with Saudi Arabia’s 2030 Vision. Part of this is investing in our young people and their future.
 Reliability Expert Center was established with the strategic vision of spreading a reliability and sustainability culture across Saudi Arabia.


Software Used: Software Used: ALTA PRO
Download Example File for Version 10 (*.rsgz10) or Version 9 (*.rsr9)
Six units are tested to failure. The objective is to use the complete data from the analysis to obtain a probability plot with 90% 2-sided confidence bounds and a pdf plot.
The following failure times are observed for 6 units: 11,260; 12,080; 12,125; 12,825; 13,550 and 14,670 hours.
Step 1: The parameters for the data are calculated using the normal distribution and rank regression on X as the parameter estimation method, as shown next.
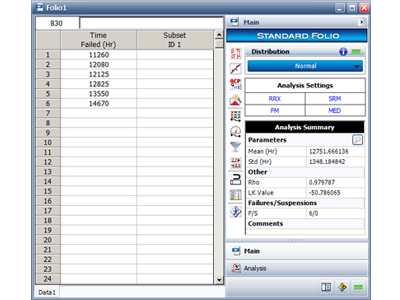
Figure 1: Standard folio with data and results.
Step 2: Next, a probability plot is created with 90% 2-sided Time (Type I) confidence bounds, as shown next.
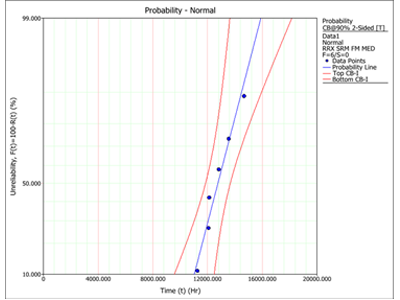
Figure 2: Normal probability plot with 90% 2-sided confidence bounds on time.
Step 3: Finally, the pdf plot is created, as shown next.
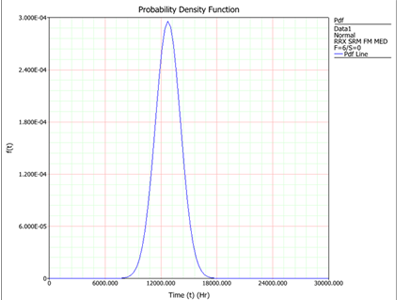
Figure 3: pdf plot.
