

 Our mission is to lead innovation by providing the most advanced solutions in reliability and sustainability to empower…
 REC is looking to the future by aligning business goals with Saudi Arabia’s 2030 Vision. Part of this is investing in our young people and their future.
 Reliability Expert Center was established with the strategic vision of spreading a reliability and sustainability culture across Saudi Arabia.


Download Example File for Version 10 (*.rsgz10) or Version 9 (*.rsr9)
Chef Toni is thinking of opening a new Italian restaurant based on another business she had already started. This new restaurant will be identical to the old one. She has asked you to evaluate the potential income of the new business (before interest and depreciation costs) based on the number of seats she can fill.
Chef Toni is expecting her restaurant to have a total seating capacity of 200 people. She plans to close the restaurant for five days only during this upcoming calendar year.
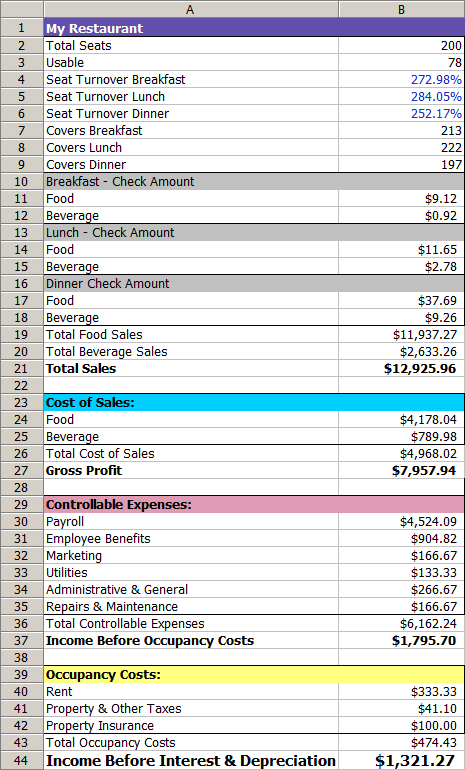
The following workbook shows how the chef calculated her income at her original business, using conservative estimates. Use the calculations in this workbook with RENO to estimate the chef’s potential average annual income based on the number of seats (“MyRestaurantTable” analysis workbook in the example file).
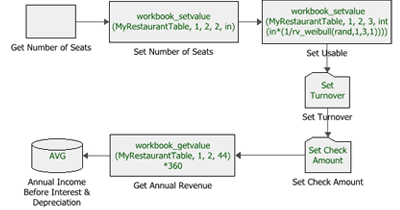
The picture shown next presents an overview of how the main flowchart will work. Note how this flowchart uses subchart blocks to group the calculations for the seat-turnover rates (“Set Turnover” block) and the calculations for the check amounts (“Set Check Amount” block).
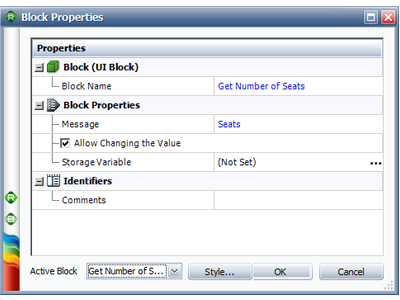
Step 1: Use a UI block to prompt the user for the seating capacity during simulation. Enter the text “Seats” for the message, and select the Allow Changing the Value checkbox, as shown next.
Step 2: Use a standard block to pass the number of available seats (obtained from the UI block) into cell B2 of the MyRestaurantTable analysis workbook. Here, the block uses the RENO internal function called “workbook_setvalue,” which has the following syntax:
workbook_setvalue(workbook_name, sheet_name, column_number, row_number, value)
In this case, the value passed to cell B2 is the output value from the previous block (represented by the RENO internal function called “in”).
Step 3: Use a standard block to pass the number of usable seats into cell B3 of the analysis workbook. This value is calculated by multiplying the value from the previous block (represented by “in”) by a random value, as described next:
int(in*(1/rv_weibull(rand,1,3,1)))
The random value is obtained from the RENO internal function called “rv_weibull.” This function returns the inverse of the Weibull cumulative distribution with the specified parameters for the specified probability. In this case, we want the function to return a random value. To do this, we use the predefined function called “rand” as the function’s probability value, and then we enter the following values for the parameters of the Weibull distribution: 1 (beta), 3 (eta) and 1 (gamma).
The resulting value for the number of usable seats is then rounded down to the nearest integer by the RENO math function called “int.”
Step 4: Use a subchart to pass the seat-turnover rates for breakfast, lunch and dinner to the analysis workbook, as shown next.

Each block sets the relevant value to a random probability value based on a normal distribution.
Step 5: Use a subchart to pass the check amounts for food and for beverages at breakfast, lunch and dinner to the analysis workbook, as shown next.
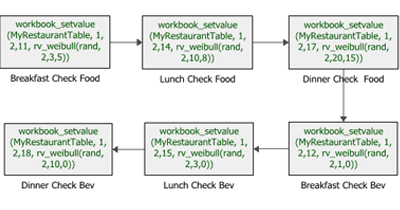
Each block sets the relevant value to a random probability value based on a Weibull distribution.
Step 6: Use a standard block to calculate the annual revenue. To do this, first get the calculated daily revenue from cell B44 of the analysis workbook. Here, the block uses the RENO internal function called “workbook_getvalue” to get the value from the workbook. The function has the following syntax:
workbook_getvalue(workbook_name, sheet_name, column_number, row_number)
The value obtained from the workbook is then multiplied by 360, which is the number of days chef Toni will have the business running in the next year. The result is the annual income for the restaurant.
Step 7: Use a result storage block to calculate the average annual income across all simulations.
Run 10 simulations with a seed of 1 for repeatability. When the UI block prompts you for the number of seats, enter 200 and then select the Do not show again for this block during current analysis check box to use the same number of seats in each simulation run.
The result shows that chef Toni’s average annual income, before interest and depreciation, is expected to be approximately $380,169.
