

 Our mission is to lead innovation by providing the most advanced solutions in reliability and sustainability to empower…
 REC is looking to the future by aligning business goals with Saudi Arabia’s 2030 Vision. Part of this is investing in our young people and their future.
 Reliability Expert Center was established with the strategic vision of spreading a reliability and sustainability culture across Saudi Arabia.


Download Example File for Version 10 (*.rsgz10) or Version 9 (*.rsr9)
A&B Shuttle Company operates in Ozi, a city between two towns. The company provides transportation services for elderly people who are not able to fly, drive or take other public transportation.
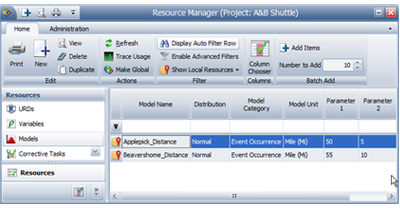
Management would like to expand operations to Applepick and Beavershome. Customers in Applepick are located with a normal distribution mean of 50 miles away from the Ozi shuttle hub, with a standard deviation of 5 miles. Beavershome customers are located with a normal distribution mean of 55 miles away from the shuttle hub, with a standard deviation of 10 miles.
The company flies two shuttles. Shuttle A can normally travel 50 miles away from the shuttle hub before having to head back, and Shuttle B can normally travel only 40 miles away from the shuttle hub. If a shuttle must pick up customers outside of range, it may use a reserve power supply, which costs $1.25 per mile.
Management would like determine the additional cost per mile that the company must absorb when a shuttle must pick up customers outside of normal shuttle range. They would also like to know which shuttle should service each town to minimize cost.
Define a variable to represent the cost per mile of the reserve power supply, and two variables to represent the shuttles’ normal ranges, as shown next.

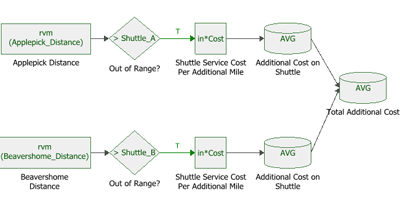
Construct the flowchart shown below.
Shuttle A goes to Applepick, and Shuttle B goes to Beavershome.
There are two paths in this flowchart: the first path calculates the additional costs of having Shuttle A go to Applepick, while the second path calculates the additional costs of having Shuttle B go to Beavershome. To construct this flowchart, follow these steps:
Step 1: Use standard blocks to represent the distance that the customers in each town live from the hub. For example, the Applepick Distance block uses the RENO internal function called “rvm” to return a random value based on the Applepick_Distance model.
Step 2: Use conditional blocks to compare the customers’ distance to the variable representing the shuttle range. In this scenario, we assume that Shuttle A is used for the Applepick route. Configure the conditional block as shown below.
Each flowchart is simulated 1,000 times, using a seed of 1 for repeatability. The results show that:
If Shuttle A goes to Applepick, and Shuttle B goes to Beavershome:
If Shuttle B goes to Applepick, and Shuttle A goes to Beavershome:
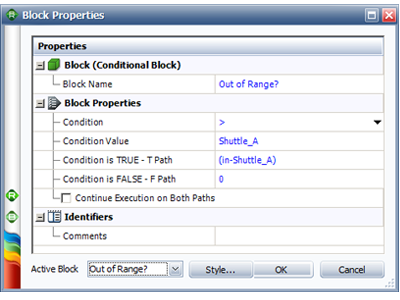
This block compares the incoming value (i.e., the Applepick customer’s distance) to Shuttle A’s range. If the customer lives within the shuttle’s range, then no value is passed. If the customer lives outside of the shuttle’s range, then the distance out of range is calculated and passed down the “true” path.
Step 3: Use standard blocks to multiply the distance out of range by the cost per mile for the reserve power supply.
Step 4: Use result storage blocks to average the costs for each shuttle and overall.
Construct a separate flowchart to model the second scenario. You can do this by duplicating the first flowchart and then switching the locations of the two conditional blocks so that the Applepick customer’s distance is compared to Shuttle B’s range and the Beavershome customer’s distance is compared to Shuttle A’s range.
