

 Our mission is to lead innovation by providing the most advanced solutions in reliability and sustainability to empower…
 REC is looking to the future by aligning business goals with Saudi Arabia’s 2030 Vision. Part of this is investing in our young people and their future.
 Reliability Expert Center was established with the strategic vision of spreading a reliability and sustainability culture across Saudi Arabia.


Download Example File for Version 10 (*.rsgz10) or Version 9 (*.rsr9)
Your nine year old daughter is about to have a birthday party and she invited forty of her friends. Of course, you are in charge of serving them lunch. Due to budgetary constraints, you decide to do it yourself rather than have it catered.
You have hamburgers, hot dogs and pizza on the menu. Assume the following:
Determine the number of portions needed for each item.
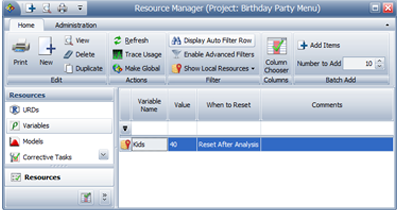
Create a variable to define the number of kids invited to the party, as shown next.
The following flowchart shows one approach to solving the problem.
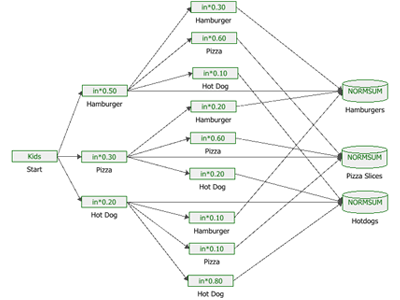
To construct this flowchart, follow these steps:
Step 1: Use a standard block and the Kids variable to define the number of children invited to the party.
Step 2: Use three standard blocks to calculate the number of children who eat hamburgers, the number who eat pizza and the number who eat hot dogs for their first item. Use the RENO internal function called “in” to insert the output of the previous block into the equations.
Step 3: Use nine standard blocks to calculate the number of children who eat hamburgers, pizza or hot dogs for their second item. For example, if the first item was a hamburger, then of the 50% of the children who ate hamburgers, 30% will choose hamburgers for their second item, 60% will choose pizza and 10% will choose hotdogs.
Step 4: Use result storage blocks to calculate the total amount of each type of food consumed and normalize the results.
You will need to perform only 1 simulation since there are no random values. The results show the following estimates:
