Our mission is to lead innovation by providing the most advanced solutions in reliability and sustainability to empower…
 REC is looking to the future by aligning business goals with Saudi Arabia’s 2030 Vision. Part of this is investing in our young people and their future.
 Reliability Expert Center was established with the strategic vision of spreading a reliability and sustainability culture across Saudi Arabia.


Download Example File for Version 10 (*.rsgz10) or Version 9 (*.rsr9)
A given aircraft can have a maximum of 100 coach seats. Two coach seats are removed for each first class seat that is added. For example, if four first class seats were added, then the maximum number of coach seats is would be 92.
Assume the following:
Determine the optimum allocation of first class seats, assuming that only increments of four seats are allowed
Define a variable to specify the number of first class seats, as shown below. This variable will be varied during simulation to estimate the optimum number of seats.
Define two models to describe the demand for coach tickets and first class tickets, as shown next.
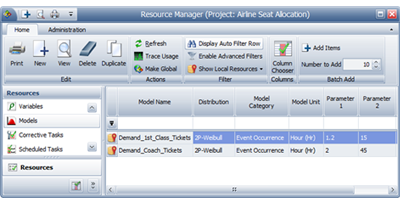
Note that to measure the demand, the Model Unit has been set to Hours. This is because RENO flowchart results are always given in terms of the system base unit (SBU), and resources that require you to define a unit (i.e., Synthesis models) will have their values automatically converted to base units during simulation. Therefore, whenever you don’t want RENO to convert the value obtained from a model resource, simply make sure the model uses a unit that is defined as equal to 1 SBU. See the application help file for more information.
For this example, whenever one of the models returns a value as “X hours,” it should be read as “X number of tickets.” If the model unit you are using is not equal to 1 SBU (choose File > Manage Repository > Manage Units to confirm), you will need to change the model units before resimulating the flowchart.
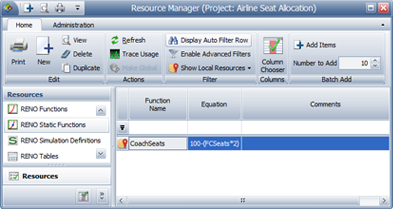
Define a RENO static function to calculate the number of coach seats, which depends on the number of first class seats.
The following picture shows an overview of the flowchart for the problem.
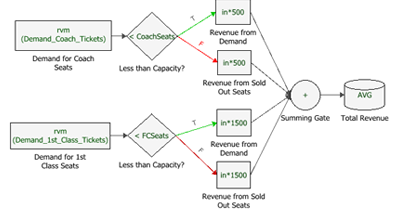
The flowchart is divided into two paths: the first path calculates the total revenue for coach seats, while the second path calculates the total revenue for first class seats. Each path uses the following blocks:

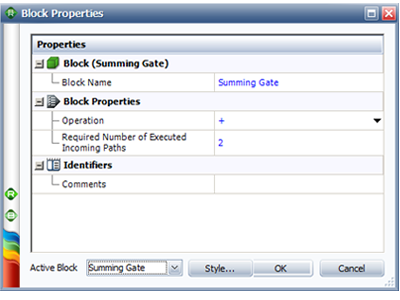
A summing gate collects the revenue from all four incoming paths. Note that the Required Number of Executed Incoming Paths field in the summing gate must be set to 2. This ensures that the values from the “Revenue from Demand” and the “Revenue from Sold Out Seats” blocks in each path are added before they are passed to the result storage block.
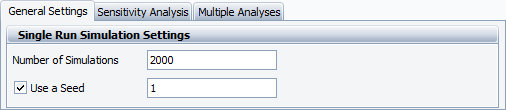
On the General Settings page of the RENO Simulation window, specify 2,000 simulations and enter a seed of 1 for repeatability, as shown next.
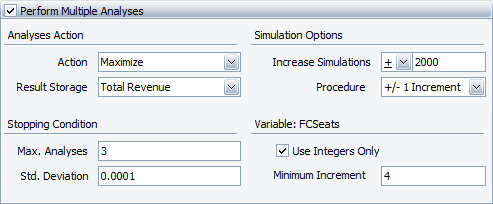
Based on these settings, RENO will perform up to three analyses (or fewer if the results converge to within 0.0001 of each other before the three analyses are complete) to find the maximum value of the result storage block called “Total Revenue.”
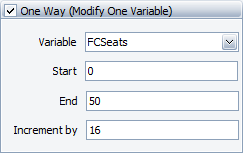
Each analysis will consist of the number of runs determined in the Sensitivity Analysis page. In addition, the number of simulations will be increased by 2,000 in each subsequent analysis to further refine the results. We’ve also specified to use only integers with a minimum increment of 4 to ensure that only multiples of 4 are used as RENO narrows the value range of FCSeats over multiple analyses.
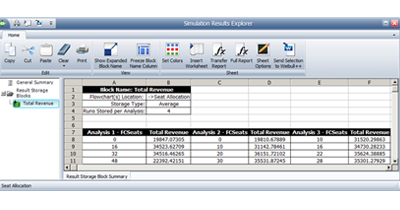
When the simulation completes, click the Details button in the RENO Simulation window to open the Simulation Result Explorer. Select the result storage block to display details about each analysis, as shown below.
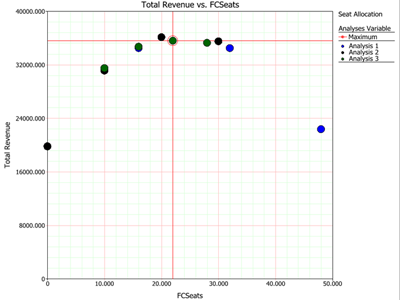
Based on the results of the third analysis, the optimum number of first class seats is 22, with an expected revenue of $35,624.38885.
Close the Simulation Results Explorer window and generate a plot of the results by clicking the Plot icon on the diagram’s control panel.