Our mission is to lead innovation by providing the most advanced solutions in reliability and sustainability to empower…
 REC is looking to the future by aligning business goals with Saudi Arabia’s 2030 Vision. Part of this is investing in our young people and their future.
 Reliability Expert Center was established with the strategic vision of spreading a reliability and sustainability culture across Saudi Arabia.


Software Used: Software Used: ALTA PRO
Download Example File for Version 10 (*.rsgz10) or Version 9 (*.rsr9)
Assume you have a community of 100 people.
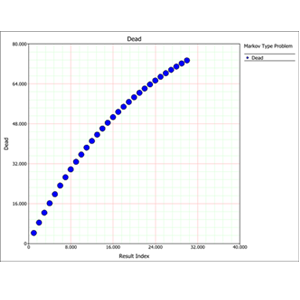
You want to know how many people will still be alive after 1, 2,…, 30 years.
Define variables to represent each state of health: the number of people who are healthy, the number who are sick, the number of people who will get sick within each year and the number who are dead. The initial value for Healthy is 83 and the initial value for Sick is 17, as shown below.

One simple way to approach the problem is to construct the flowchart shown next.
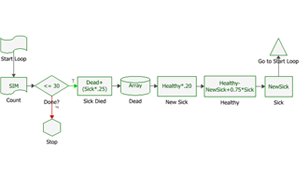
The variables are used to keep count of the number of people in each state of health. To model the process of how the variables change through time, the flowchart uses a loop instead of a series of simulations. Each loop represents a single year. This loop is created by using the following blocks:
Within each loop, the number of people who died within the year is calculated and the output is stored in the Dead variable. For example, the properties for the block called “Sick Died” are shown next.
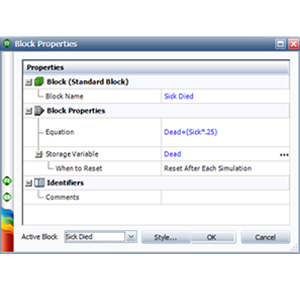
The number of people who died during the year is equal to 25% of the number of sick people plus the number of people who are already dead. The block’s Storage Variable field indicates that the output is stored in the Dead variable, replacing the previous year’s figure. Storing the output into a storage variable allows the block to keep track of the number of deaths each year. This setup is also used for the NewSick, Healthy and Sick variables.
The When to Reset field indicates that the Dead variable will be reset to its initial value at the end of each simulation. To retain the results, the result storage block called “Dead” stores each new value of the Dead variable in an array.
The “New Sick” block calculates the number of people who became sick during the year. The output is then stored in the NewSick variable, replacing the previous year’s figure.
The “Healthy” block calculates the number of people who were healthy at the end of the year. This is calculated by subtracting the number of people who became sick during the current year (NewSick) from the number of healthy people from the previous year (Healthy). The number of people who recovered from sickness the previous year (0.75*Sick) is then added to the figure. Finally, the output is stored in the Healthy variable to replace the previous year’s figure.
The “Sick” block stores the value of NewSick into the Sick variable, again replacing the previous year’s figure.
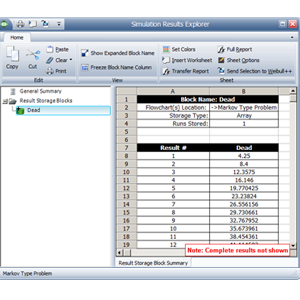
Because all probabilities are fixed, you will need to run only one simulation. When simulation is complete, click the Details button in the RENO Simulation window to open the Simulation Results Explorer. Select the result storage block called “Dead” to display the stored values (i.e., cumulative number of deaths each year), as shown below.
The following picture shows a plot of these results.