Our mission is to lead innovation by providing the most advanced solutions in reliability and sustainability to empower…
 REC is looking to the future by aligning business goals with Saudi Arabia’s 2030 Vision. Part of this is investing in our young people and their future.
 Reliability Expert Center was established with the strategic vision of spreading a reliability and sustainability culture across Saudi Arabia.


Software Used: Software Used: ALTA PRO
Download Example File for Version 10 (*.rsgz10) or Version 9 (*.rsr9)
Consider the case of a washing machine that can have varied loads:
Assuming that customer loads vary from 2 to 8 pounds, the expected load in the field can be described by a normal distribution with mean = 5 and std = 1 pound.
Let us assume that the effect of load weight on the life of the washing machine is described by an inverse power life-stress relationship:
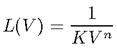
where L is the life of the machine and V is the load. The constants K and n can be obtained by solving for the equation based on the given conditions: L(V=5) = 10,000 and L(V=10) = 2,500. Therefore, K = 0.000004 and n = 2.
(See also http://reliawiki.org/index.php/Inverse_Power_Law_Relationship for more information about the inverse power law model.)
Create a model to describe the variations in customer loads, as shown next.


Create RENO static functions to describe the life-stress relationship (LSR) and the failure time of the washing machine based on this relationship.
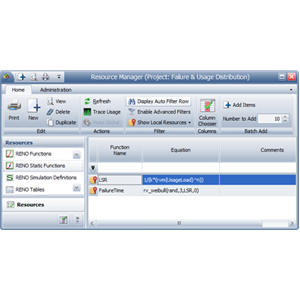
Here, LSR uses the RENO internal function called “rvm” to return a random value based on the UsageLoad model.
FailureTime uses the internal function called “rv_weibull” to return a random time to failure based on the washing machine’s failure distribution. This function returns the inverse of the Weibull cumulative distribution with the specified parameters for the specified probability. In this case, we want the function to return a random value. To do this, we use the predefined function called “rand” as the function’s probability value, and then we enter the following parameters for the distribution: 3 (beta), the variable LSR (eta) and 0 (gamma).
To estimate the reliability at 2,000 hours, create the flowchart shown below.
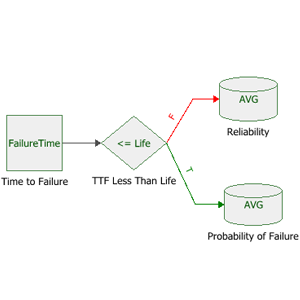
In this example, the standard block uses FailureTime to obtain a random time to failure based on customer load.
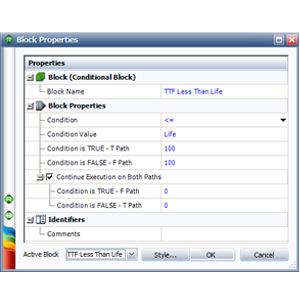
The conditional block evaluates whether the failure time (obtained from the previous block) occurred before the time of interest (the variable called “Life,” which was set to 2,000).
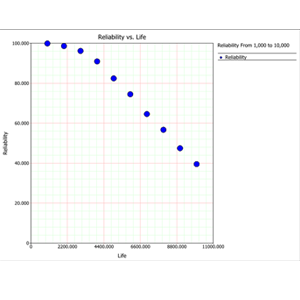
You can use the sensitivity analysis feature to create a plot that shows how the reliability varies over time.
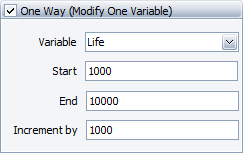
In the RENO Simulation window, keep the same number of simulations (10,000) and seed (1). Then on the Sensitivity Analysis tab, specify to vary the Life variable from 1,000 to 10,000 hours, with increments of 1,000 hours, as shown below.
The following picture shows a plot of the reliability from 1,000 to 10,000 hours.
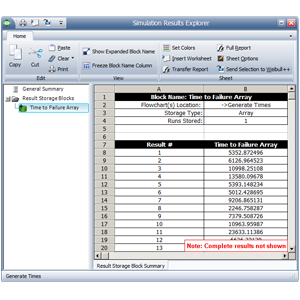
To generate a set of times-to-failure data that can be used for subsequent life data analysis, construct the flowchart shown below.
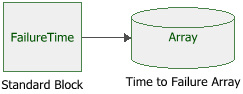
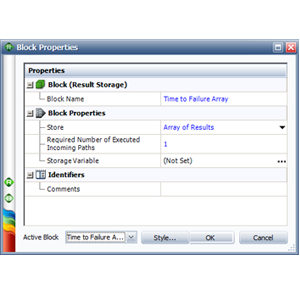
Run 1,000 simulation with a seed of 1 for repeatability. Once the simulation completes, click the Details button in the RENO Simulation window to open the Simulation Results Explorer. Select the result storage block to display the stored values, as shown below.