Our mission is to lead innovation by providing the most advanced solutions in reliability and sustainability to empower…
 REC is looking to the future by aligning business goals with Saudi Arabia’s 2030 Vision. Part of this is investing in our young people and their future.
 Reliability Expert Center was established with the strategic vision of spreading a reliability and sustainability culture across Saudi Arabia.


Software Used: Software Used: ALTA PRO
Download Example File for Version 10 (*.rsgz10) or Version 9 (*.rsr9)
A specific consumer product (e.g., a mouthwash, shampoo, etc.) is made up of three main ingredients (ingredients A, B and C) that have a characteristic (e.g., concentration) that may or may not change with time. A quantitative measure of a characteristic can be obtained, and this measure must be within a specified range for compliance. If any measure is outside its specified range, then the product is out of compliance and considered failed. There is no known dependency among these ingredients, and thus they are assumed to be statistically independent.
The product has a shelf life of 24 months. Determine the probability that a given specimen will be out of compliance at or after this time period.
For this study, 40 random products (specimens) are stored at normal use conditions. At 3, 6, 9 and 12 months, 10 specimens are removed and measured. The measurement process is a destructive test (i.e., once the specimen is opened for testing, the required readings are taken and the specimen is then disposed of). Measurements for each ingredient (A, B and C) and at each time period are given in the following tables.
Since all of the readings are above the critical QM threshold of 50, none of the samples tested in this experiment have gone out of compliance (or “failed”) by the end of the test. However, there is sufficient data for the degradation of each sample to extrapolate a failure (i.e., the month at which we expect each sample to be at QM=50).
Using ALTA’s degradation analysis folio, the data for all samples are entered and individually fitted to multiple exponential curves. From each respective curve, a failure time (i.e., the time the product is expected to go out of compliance) is automatically extrapolated and fit to the selected ALTA model (in this case, Arrhenius-Weibull).
Figure 1: Degradation analysis folio.
The following plot shows the exponential curves for six of the tested samples (with the scaling adjusted to Y= 40 to 100 and X= 0 to 20).
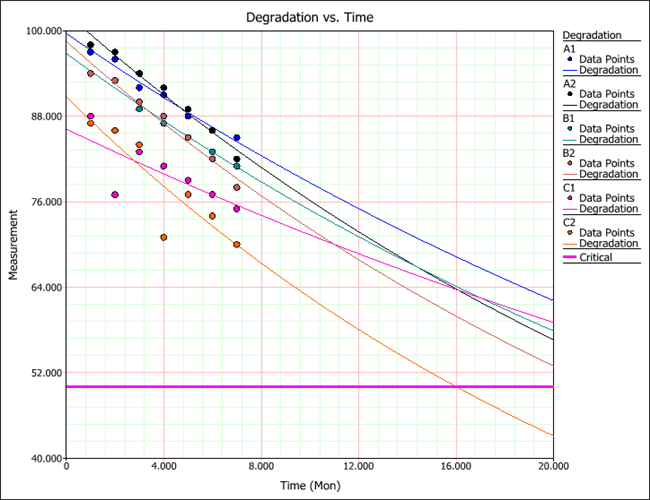
Figure 2: Degradation vs. Time plot for 6 of the tested samples.
A Use Level Probability plot is shown next.
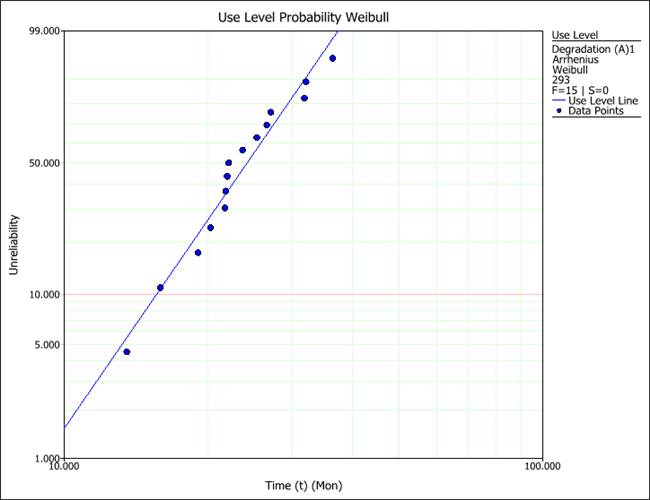
Figure 3: Use Level Probability plot.
A Reliability vs. Time plot for this product, also at the use stress level, is shown next.
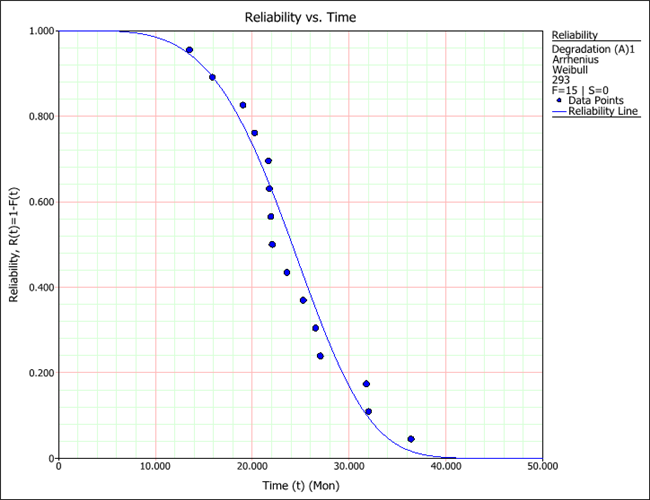
Figure 4: Reliability vs. Time plot.
A Life vs. Stress plot, where the green line represents the time by which 10% of the units are expected to be out of compliance (at a given temperature), is shown next.
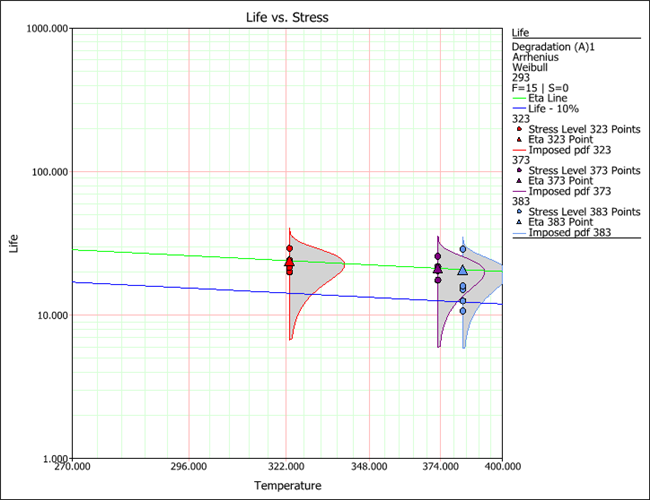
Figure 5: Life vs. Stress plot.
A Standardized Residual plot of the data and fitted model to ascertain adequacy is shown next.

Figure 6: Standardized Residuals plot.
Based on this analysis, the projected shelf life of this product is 15.6 months. The desired result can also be obtained from the QCP, as shown next.