

 Our mission is to lead innovation by providing the most advanced solutions in reliability and sustainability to empower…
 REC is looking to the future by aligning business goals with Saudi Arabia’s 2030 Vision. Part of this is investing in our young people and their future.
 Reliability Expert Center was established with the strategic vision of spreading a reliability and sustainability culture across Saudi Arabia.


Software Used: Software Used: ALTA or ALTA PRO
Download Example File for Version 10 (*.rsgz10) or Version 9 (*.rsr9)
A reliability group in a semiconductor company is planning an accelerated test for an electronic device. The purpose of the accelerated test is to estimate the B10 life of the device under normal use conditions. 30 sample units are available and the test is planned to last for 600 hours. Temperature and voltage have been determined to be the main factors affecting the reliability of the device. The normal use conditions are 300 K for temperature and 4 V for voltage. The reliability engineers want to use a three-level optimum test plan because it will be easier to manage than a five-level test plan.
Based on engineering knowledge and data from a pilot test, the following information about the device’s expected failure behavior is available to help with planning the test.
Step 1: Using ALTA or ALTA PRO, the analysts add a test plan to a project. The figure below shows the test planning inputs entered on the Test Plan Inputs sheet. In this utility, the BX% Life Estimate Sought field contains the value (as a percentage) that the engineers want to estimate when they analyze the data from the test. In this case, they enter 10 to indicate the B10 life (i.e., the time at which 10% of units are expected to be failed).
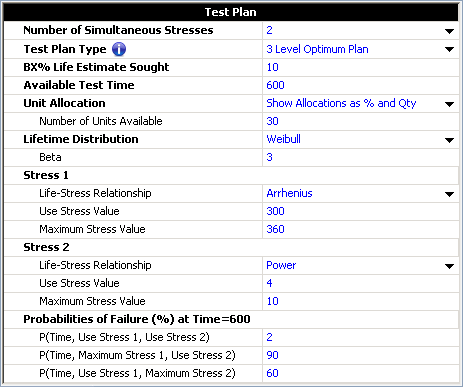
Figure 1: Test Plan Inputs sheet.
Step 2: The analysts generate the plan and view the results on the Test Plan Result sheet, as shown next.
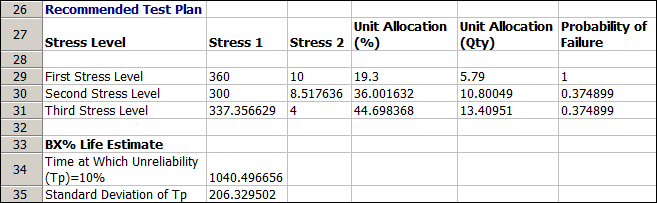
Figure 2: Rows 26 to 35 of the Test Plan Results sheet.
The above figure shows rows 26 to 35 of the results sheet. As can be seen in the results, the three-level optimum plan recommends the following stress combinations for the accelerated test:
Step 3: The analysts evaluate the suggested test plan based on its capability to yield enough failure data. In this example, they can expect approximately 6 failures for the 1st stress combination (since the probability of failure is expected to be 100% for the 6 units tested at that level), 4 failures for the 2nd stress combination (11 units * 0.3749 probability of failure) and 5 failures for the 3rd stress combination (i.e., 13 units * 0.3749 probability of failure). In this case, they determined that the recommended design will produce enough failure data for the purpose of their analysis.
Step 4: Using the control panel, the analysts can further evaluate the test plan by solving for any one of three criteria (bounds ratio, confidence level or sample size) given that the other two criteria are known.
The analysts specify a confidence level of 90% and a sample size of 30 in the control panel, as shown next. With this test plan, the ratio of the upper confidence bound to the lower confidence bound of the B10 life estimate is calculated to be 1.92. The bounds ratio indicates how wide the 90% two-sided confidence bounds would be and helps to evaluate the variance on the B10 estimate that may be obtained if the recommended test plan were implemented.
The analysts calculate what the confidence level would be if they were to specify a narrower bounds ratio of 1.5 and a sample size of 30 units. As shown next, the confidence level is calculated to be 69.34%.

Figure 4: Solving for confidence level.
The analysts calculate how many units must be tested in order to achieve a bounds ratio of 1.5 and a confidence level of 90%. As shown next, the sample size is calculated to be approximately 78 units. This means that in order to be more precise with the B10 life estimate, more data will be needed, hence the need to increase the number of test units in the accelerated test.

Figure 5: Solving for sample size.
Figure 7: Results for the new test plan.
Therefore, in order to obtain the B10 life of the device, with a bounds ratio of 1.5 at the 90% confidence level, the accelerated test should be designed to:

