Our mission is to lead innovation by providing the most advanced solutions in reliability and sustainability to empower…
 REC is looking to the future by aligning business goals with Saudi Arabia’s 2030 Vision. Part of this is investing in our young people and their future.
 Reliability Expert Center was established with the strategic vision of spreading a reliability and sustainability culture across Saudi Arabia.


Software Used: Software Used: ALTA or ALTA PRO
Download Example File for Version 10 (*.rsgz10) or Version 9 (*.rsr9)
The accelerating stress for an electronic component is temperature. To meet the specified reliability requirement, the manufacturer is required to demonstrate with 90% confidence that 90% of the units will continue to operate for 1,000 hours under normal use conditions of 300 K. To save time and money, the manufacturer develops an accelerated life test designed to provide the desired reliability results in a shorter period of time than would be possible with a test performed under normal stress conditions.
A sample of units are put to an accelerated life test with three different stress levels: 353 K, 373 K and 393 K. The failure times obtained during this test are presented in the table shown next.
| Stress Level (K) | 353 | 373 | 393 |
| Failure Time (Hr) | 245 | 110 | 50 |
| Did not fail | 180 | 70 | |
| Did not fail | 200 | 88 | |
| Did not fail | Did not fail | 112 | |
| Did not fail | Did not fail | 140 | |
| Did not fail | Did not fail | 160 |
This information can be used to determine the following:
a) What is the activation energy?
b) Is the B10 life of 1,000 hours at a 90% lower 1-sided confidence for the use stress level (300 K) demonstrated by the test?
c) Plot the acceleration factor vs. stress for this accelerated life test.
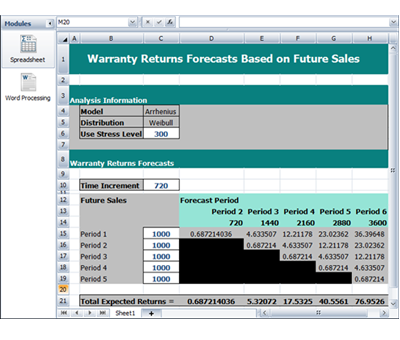
d) Assuming that 1,000 units will be sold each month, determine the expected number of failures over the next six months so that an appropriate stock of spare parts can be kept on hand.
Step 1: Using ALTA or ALTA PRO, the analyst creates a standard folio for failure and suspension times with one stress column for temperature (in kelvins, K), with a use stress level of 300 K. The data set is analyzed in ALTA using a combination of the Arrhenius model and the Weibull distribution. The results show an activation energy (Ea) = 0.465299, as shown next.
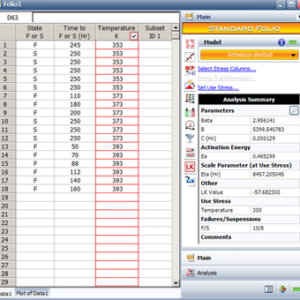
Figure 1: Calculated results from the simple accelerated demonstration test.
Step 2: Once the parameters have been calculated, a variety of plots, results and reports can be obtained.
B10 Life: The QCP can be used to calculate the B10 life with the specified confidence bounds, as shown next.

Figure 2: The calculated B10 life with 90% lower one-sided confidence bounds.

Figure 3: Determining the B10 life demonstrated by the test from the use level Weibull probability plot.
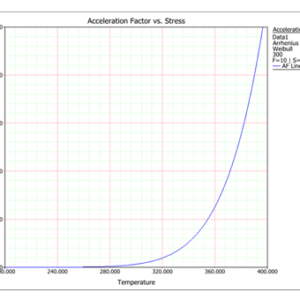
Figure 4: Acceleration Factor vs. Stress plot for the accelerated demonstration test data analysis.
Expected Number of Failures: The analyst creates a Synthesis Workbook report (Version 10 only) using the data from the calculated standard folio and based on the “ALTA Warranty Forecasts” template.
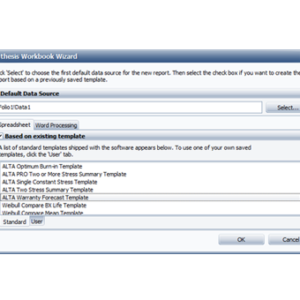
Figure 5: Setting up a new Synthesis Workbook.
Then the following inputs are entered into the spreadsheet module of the Synthesis Workbook:
The final report is shown next.